
The overall performance criteria of computer systems are response time and throughput.
Response time is the elapsed time between when a request is submitted and when the response from that request is returned. Examples include:
• The amount of time a database query takes
• The amount of time it takes to echo characters to the terminal
• The amount of time it takes to access a Web page
Throughput is a measure of the amount of work that can be accomplished over some unit of time. Examples include:
• Database transactions per minute
• Kilobytes of a file transferred per second
• Kilobytes of a file read or written per second
• Web server hits per minute
The relationship between these metrics is complex. Sometimes you can have higher throughput at the cost of response time or better response time at the cost of throughput. In other situations, a single change can improve both. Acceptable performance is based on reasonable throughput combined with reasonable response time.
In planning for or tuning any system, make sure that you have clear objectives for both response time and throughput when processing the specified workload. Otherwise, you risk spending analysis time and resource dollars improving an aspect of system performance that is of secondary importance.
Program execution model :- To clearly examine the performance characteristics of a workload, a dynamic rather than a static model of program execution is necessary, as shown in the following figure.
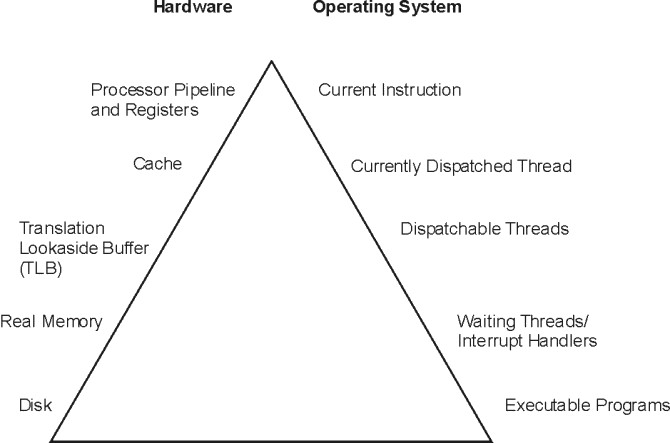
Figure 1. Program Execution Hierarchy.
The figure is a triangle on its base. The left side represents hardware entities that are matched to the appropriate operating system entity on the right side. From bottom to top, the disk hardware entity holds executable programs; real memory (RAM) holds waiting operating system threads and interrupt handlers; TLB holds dispatchable threads; cache contains the currently dispatched thread and the processor pipeline and registers contain the current instruction.
To run, a program must make its way up both the hardware and operating-system hierarchies in parallel. Each element in the hardware hierarchy is more scarce and more expensive than the element below it. Not only does the program have to contend with other programs for each resource, the transition from one level to the next takes time. To understand the dynamics of program execution, you need a basic understanding of each of the levels in the hierarchy.
Hardware hierarchy :- Usually, the time required to move from one hardware level to another consists primarily of the latency of the lower level (the time from the issuing of a request to the receipt of the first data).
Fixed disks - The slowest operation for a running program on a standalone system is obtaining code or data from a disk, for the following reasons:
- The disk controller must be directed to access the specified blocks (queuing delay).
- The disk arm must seek to the correct cylinder (seek latency).
- The read/write heads must wait until the correct block rotates under them (rotational latency).
- The data must be transmitted to the controller (transmission time) and then conveyed to the application program (interrupt-handling time).
Slow disk operations can have many causes besides explicit read or write requests in the program. System-tuning activities frequently prove to be hunts for unnecessary disk I/O. Real memory :- Real memory, often referred to as Random Access Memory, or RAM, is faster than disk, but much more expensive per byte -:). Operating systems try to keep in RAM only the code and data that are currently in use, storing any excess onto disk, or never bringing them into RAM in the first place.RAM is not necessarily faster than the processor though. Typically, a RAM latency of dozens of processor cycles occurs between the time the hardware recognizes the need for a RAM access and the time the data or instruction is available to the processor.If the access is going to a page of virtual memory that is stored over to disk, or has not been brought in yet, a page fault occurs, and the execution of the program is suspended until the page has been read from disk.
Translation Lookaside Buffer (TLB) :-
Programmers are insulated from the physical limitations of the system by the implementation of virtual memory. You design and code programs as though the memory were very large, and the system takes responsibility for translating the program's virtual addresses for instructions and data into the real addresses that are needed to get the instructions and data from RAM. Because this address-translation process can be time-consuming, the system keeps the real addresses of recently accessed virtual-memory pages in a cache called the translation lookaside buffer (TLB).As long as the running program continues to access a small set of program and data pages, the full virtual-to-real page-address translation does not need to be redone for each RAM access. When the program tries to access a virtual-memory page that does not have a TLB entry, called a TLB miss, dozens of processor cycles, called the TLB-miss latency are required to perform the address translation.
Caches :-
To minimize the number of times the program has to experience the RAM latency, systems incorporate caches for instructions and data. If the required instruction or data is already in the cache, a cache hit results and the instruction or data is available to the processor on the next cycle with no delay. Otherwise, a cache miss occurs with RAM latency.
Pipeline and registers :-
A pipelined, superscalar architecture makes possible, under certain circumstances, the simultaneous processing of multiple instructions. Large sets of general-purpose registers and floating-point registers make it possible to keep considerable amounts of the program's data in registers, rather than continually storing and reloading the data.
Software hierarchy
To run, a program must also progress through a series of steps in the software hierarchy.
- Executable programs :- When you request a program to run, the operating system performs a number of operations to transform the executable program on disk to a running program. The operating system also automatically creates a single thread within that process. A thread is the current execution state of a single instance of a program. In AIX®, access to the processor and other resources is allocated on a thread basis, rather than a process basis. Multiple threads can be created within a process by the application program. Those threads share the resources owned by the process within which they are running. Finally, the system branches to the entry point of the program. If the program page that contains the entry point is not already in memory (as it might be if the program had been recently compiled, executed, or copied), the resulting page-fault interrupt causes the page to be read from its backing storage.
- Interrupt handlers :- The mechanism for notifying the operating system that an external event has taken place is to interrupt the currently running thread and transfer control to an interrupt handler. Before the interrupt handler can run, enough of the hardware state must be saved to ensure that the system can restore the context of the thread after interrupt handling is complete. Newly invoked interrupt handlers experience all of the delays of moving up the hardware hierarchy (except page faults). Unless the interrupt handler was run very recently (or the intervening programs were very economical), it is unlikely that any of its code or data remains in the TLBs or the caches. When the interrupted thread is dispatched again, its execution context (such as register contents) is logically restored, so that it functions correctly. However, the contents of the TLBs and caches must be reconstructed on the basis of the program's subsequent demands. Thus, both the interrupt handler and the interrupted thread can experience significant cache-miss and TLB-miss delays as a result of the interrupt.
- Waiting threads :- Whenever an executing program makes a request that cannot be satisfied immediately, such as a synchronous I/O operation (either explicit or as the result of a page fault), that thread is put in a waiting state until the request is complete. Normally, this results in another set of TLB and cache latencies, in addition to the time required for the request itself.
- Dispatchable threads :- When a thread is dispatchable but not running, it is accomplishing nothing useful. Worse, other threads that are running may cause the thread's cache lines to be reused and real memory pages to be reclaimed, resulting in even more delays when the thread is finally dispatched.
- Currently dispatched threads :- The scheduler chooses the thread that has the strongest claim to the use of the processor.
- Current machine instructions :- Most of the machine instructions are capable of executing in a single processor cycle if no TLB or cache miss occurs.
System tuning :-
After efficiently implementing application programs, further improvements in the overall performance of your system becomes a matter of system tuning. The main components that are subject to system-level tuning are: Communications I/O Depending on the type of workload and the type of communications link, it might be necessary to tune one or more of the following communications device drivers:
TCP/IP, or NFS.
Fixed Disk
The Logical Volume Manager (LVM) controls the placement of file systems and paging spaces on the disk, which can significantly affect the amount of seek latency the system experiences. The disk device drivers control the order in which I/O requests are acted upon. Real Memory
The Virtual Memory Manager (VMM) controls the pool of free real-memory frames and determines when and from where to steal frames to replenish the pool.
Running Thread - The scheduler determines which dispatchable entity should next receive control. In AIX®, the dispatchable entity is a thread. See Thread support.
Performance tuning - Performance tuning of the system and workload is very important.
• The performance-tuning process
Performance tuning is primarily a matter of resource management and correct system-parameter setting.
• Performance benchmark
When we attempt to compare the performance of a given piece of software in different environments, we are subject to a number of possible errors, some technical, some conceptual. This section contains mostly cautionary information. Other sections of this book discuss the various ways in which elapsed and process-specific times can be measured.
Tuning the workload and the system for efficient resource use consists of the following steps:
1. Identifying the workloads on the system
2. Setting objectives:
a. Determining how the results will be measured
b. Quantifying and prioritizing the objectives
3. Identifying the critical resources that limit the system's performance
4. Minimizing the workload's critical-resource requirements:
a. Using the most appropriate resource, if there is a choice
b. Reducing the critical-resource requirements of individual programs or system functions
c. Structuring for parallel resource use
5. Modifying the allocation of resources to reflect priorities
a. Changing the priority or resource limits of individual programs
b. Changing the settings of system resource-management parameters
6. Repeating steps 3 through 5 until objectives are met (or resources are saturated)
7. Applying additional resources, if necessary
• Identification of the workloads
It is essential that all of the work performed by the system be identified. Especially in LAN-connected systems, a complex set of cross-mounted file systems can easily develop with only informal agreement among the users of the systems. These file systems must be identified and taken into account as part of any tuning activity.
• Importance of setting objectives
Although you can set objectives in terms of measurable quantities, the actual desired result is often subjective, such as satisfactory response time. Further, the analyst must resist the temptation to tune what is measurable rather than what is important. If no system-provided measurement corresponds to the desired improvement, that measurement must be devised.
• Identification of critical resources
In general, the performance of a given workload is determined by the availability and speed of one or two critical system resources. The analyst must identify those resources correctly or risk falling into an endless trial-and-error operation.
• Minimizing critical-resource requirements
Consider minimizing the workload's critical-resource requirements at three levels.
• Resource allocation priorities
The operating system provides a number of ways to prioritize activities.
• Repeating the tuning steps
A truism of performance analysis is that there is always a next bottleneck. Reducing the use of one resource means that another resource limits throughput or response time.
It is essential that all of the work performed by the system be identified. Especially in LAN-connected systems, a complex set of cross-mounted file systems can easily develop with only informal agreement among the users of the systems. These file systems must be identified and taken into account as part of any tuning activity. With multiuser workloads, the analyst must quantify both the typical and peak request rates. It is also important to be realistic about the proportion of the time that a user is actually interacting with the terminal.
- An important element of this identification stage is determining whether the measurement and tuning activity has to be done on the production system or can be accomplished on another system (or off-shift) with a simulated version of the actual workload. The analyst must weigh the greater authenticity of results from a production environment against the flexibility of the non production environment, where the analyst can perform experiments that risk performance degradation or worse.
Importance of setting objectives
Although you can set objectives in terms of measurable quantities, the actual desired result is often subjective, such as satisfactory response time. Further, the analyst must resist the temptation to tune what is measurable rather than what is important. If no system-provided measurement corresponds to the desired improvement, that measurement must be devised.
The most valuable aspect of quantifying the objectives is not selecting numbers to be achieved, but making a public decision about the relative importance of (usually) multiple objectives. Unless these priorities are set in advance, and understood by everyone concerned, the analyst cannot make trade-off decisions without incessant consultation. The analyst is also apt to be surprised by the reaction of users or management to aspects of performance that have been ignored. If the support and use of the system crosses organizational boundaries, you might need a written service-level agreement between the providers and the users to ensure that there is a clear common understanding of the performance objectives and priorities.
Identification of critical resources
In general, the performance of a given workload is determined by the availability and speed of one or two critical system resources. The analyst must identify those resources correctly or risk falling into an endless trial-and-error operation.
Systems have both real, logical, and possibly virtual resources. Critical real resources are generally easier to identify, because more system performance tools are available to assess the utilization of real resources. The real resources that most often affect performance are as follows:
- CPU cycles
- Memory
- I/O bus
- Various adapters
- Disk space
- Network access
Logical resources are less readily identified. Logical resources are generally programming abstractions that partition real resources. The partitioning is done to share and manage the real resource. You can use virtual resources on POWER5™-based IBM® System p™ systems, including Micro-Partitioning™, virtual Serial Adapter, virtual SCSI and virtual Ethernet. Some examples of real resources and the logical and virtual resources built on them are as follows:
It is important to be aware of logical and virtual resources as well as real resources. Threads can be blocked by a lack of logical resources just as for a lack of real resources, and expanding the underlying real resource does not necessarily ensure that additional logical resources will be created. For example, the NFS server daemon, or nfsd daemon on the server is required to handle each pending NFS remote I/O request. The number of nfsd daemons therefore limits the number of NFS I/O operations that can be in progress simultaneously. When a shortage of nfsd daemons exists, system instrumentation might indicate that various real resources, like the CPU, are used only slightly. You might have the false impression that your system is under-used and slow, when in fact you have a shortage of nfsd daemons which constrains the rest of the resources. A nfsd daemon uses processor cycles and memory, but you cannot fix this problem simply by adding real memory or upgrading to a faster CPU. The solution is to create more of the logical resource, the nfsd daemons.
- CPU
- Processor time slice
- CPU entitlement or Micro-Partitioning
- Virtual Ethernet
- Memory
- Page frames
- Stacks
- Buffers
- Queues
- Tables
- Locks and semaphores
- Disk space
- Logical volumes
- File systems
- Files
- Logical partitions
- Virtual SCSI
- Network access
- Sessions
- Packets
- Channels
- Shared Ethernet
Logical resources and bottlenecks can be created inadvertently during application development. A method of passing data or controlling a device may, in effect, create a logical resource. When such resources are created by accident, there are generally no tools to monitor their use and no interface to control their allocation. Their existence may not be appreciated until a specific performance problem highlights their importance.
Using the appropriate resource
The decision to use one resource over another should be done consciously and with specific goals in mind. An example of a resource choice during application development would be a trade-off of increased memory consumption for reduced CPU consumption. A common system configuration decision that demonstrates resource choice is whether to place files locally on an individual workstation or remotely on a server. Reducing the requirement for the critical resource. For locally developed applications, the programs can be reviewed for ways to perform the same function more efficiently or to remove unnecessary function.
At a system-management level, low-priority workloads that are contending for the critical resource can be moved to other systems, run at other times, or controlled with the Workload Manager
Structuring for parallel use of resources
Because workloads require multiple system resources to run, take advantage of the fact that the resources are separate and can be consumed in parallel.
For example, the operating system read-ahead algorithm detects the fact that a program is accessing a file sequentially and schedules additional sequential reads to be done in parallel with the application's processing of the previous data. Parallelism applies to system management as well. For example, if an application accesses two or more files at the same time, adding an additional disk drive might improve the disk-I/O rate if the files that are accessed at the same time are placed on different drives.
Resource allocation priorities
The operating system provides a number of ways to prioritize activities.
Some, such as disk pacing, are set at the system level. Others, such as process priority, can be set by individual users to reflect the importance they attach to a specific task.
Repeating the tuning steps
A truism of performance analysis is that there is always a next bottleneck. Reducing the use of one resource means that another resource limits throughput or response time.
Suppose, for example, we have a system in which the utilization levels are as follows:
CPU: 90% Disk: 70% Memory 60%
This workload is CPU-bound. If we successfully tune the workload so that the CPU load is reduced from 90 to 45 percent, we might expect a two-fold improvement in performance. Unfortunately, the workload is now I/O-limited, with utilizations of approximately the following:
CPU: 45% Disk: 90% Memory 60%
The improved CPU utilization allows the programs to submit disk requests sooner, but then we hit the limit imposed by the disk drive's capacity. The performance improvement is perhaps 30 percent instead of the 100 percent we had envisioned.
There is always a new critical resource. The important question is whether we have met the performance objectives with the resources at hand.
Attention: Improper system tuning with the vmo, ioo, schedo, no, and nfso tuning commands might result in unexpected system behavior like degraded system or application performance, or a system hang. Changes should only be applied when a bottleneck has been identified by performance analysis.
Note: There is no such thing as a general recommendation for performance dependent tuning settings.
Applying additional resources
If, after all of the preceding approaches have been exhausted, the performance of the system still does not meet its objectives, the critical resource must be enhanced or expanded.
If the critical resource is logical and the underlying real resource is adequate, the logical resource can be expanded at no additional cost. If the critical resource is real, the analyst must investigate some additional questions:
- How much must the critical resource be enhanced or expanded so that it ceases to be a bottleneck?
- Will the performance of the system then meet its objectives, or will another resource become saturated first?
- If there will be a succession of critical resources, is it more cost-effective to enhance or expand all of them, or to divide the current workload with another system?
Performance benchmarking
When we attempt to compare the performance of a given piece of software in different environments, we are subject to a number of possible errors, some technical, some conceptual. This section contains mostly cautionary information. Other sections of this book discuss the various ways in which elapsed and process-specific times can be measured.
When we measure the elapsed (wall-clock) time required to process a system call, we get a number that consists of the following:
- The actual time during which the instructions to perform the service were executing
- Varying amounts of time during which the processor was stalled while waiting for instructions or data from memory (that is, the cost of cache and TLB misses)
- The time required to access the clock at the beginning and end of the call
- Time consumed by periodic events, such as system timer interrupts
- Time consumed by more or less random events, such as I/O interrupts
To avoid reporting an inaccurate number, we normally measure the workload a number of times. Because all of the extraneous factors add to the actual processing time, the typical set of measurements has a curve of the form shown in the following illustration.
Figure 1. Curve for Typical Set of Measurement.
The extreme low end may represent a low-probability optimum caching situation or may be a rounding effect.
A regularly recurring extraneous event might give the curve a bimodal form (two maxima), as shown in the following illustration.
UNIX commands for Monitoring the Performance of the System -
In this section I have tried to mention some commands which will help a performance tester to view the statistic of servers during the tests.
UNIX provides various commands and tools to monitor the system performance. These include commands like uptime, sar, ps, vmstat, iostat, netstat, nfsstat, and so on. Some of these commands and their usage is discussed below
Uptime:
The uptime command is one of the simplest commands that can be used to monitor the UNIX system performance. This command tells how long the system has been running. It gives a one-line report which contains the current time, how long the system has been running, how many users are currently logged in, and the system load averages for the past 1, 5, and 15 minutes. One such report provided by the uptime command is given here:
$ uptime 10:47am up 37 days, 25 min, 1 user, load average: 0.00, 0.00, 0.00
Sar:
The sar command is used to monitor the system utilization over a period of time. The sar command gives a high level report of the system utilization. The sar command, in its simplest form, can also be used to generate a report similar to that of the uptime command; that is, the sar command can be used instead of the uptime command. The sar command provides other advanced reports which provide details of the system utilization and its performance over a specified period of time. There are various options that can be specified with the sar command. Two such examples of the sar command with different options are given below.
The sar command with the –q option provides statistics on the average length of the run queue, the percentage of time the run queue is occupied, the average length of the swap queue, and the percentage of time the swap queue is occupied. One such report provided by the sar command using the –q option is given below:
$ sar
AIX ibm71p2 3 5 00CC923F4C00 06/29/09
System configuration: lcpu=8 ent=1.50 mode=Uncapped
00:00:00 %usr %sys %wio %idle physc %entc
19:40:00 47 33 4 16 0.15 10.1
19:50:00 46 34 4 16 0.15 10.3
20:00:00 47 33 4 16 0.15 9.9
Average 67 15 2 16 0.50 33.1
$ sar -q
AIX ibm71p2 3 5 00CC923F4C00 06/29/09
System configuration: lcpu=8 ent=1.50 mode=Uncapped
00:00:00 runq-sz %runocc swpq-sz %swpocc
00:10:00 1.4 16 1.0 81
00:20:00 1.4 15 1.0 88
00:30:00 1.4 16 1.0 88
Performance Counter Description for Sar command
runq –sz This is the length of the run queue during the interval.
plist –sz This is the number of processes in the process list.
ldavg -1 and ldavg -5 These counters give the system load average for the last minute and the past five minutes respectively.
%run occ This is the percentage of time that the run queue is occupied.
swpq-sz This is the average length of the swap queue during the interval. It includes processes which are sleeping.