Key Terminologies Of Performance Testing - Its very important to for a performance tester to understand the terminology involved in performance testing. Although different authoures use different terms I am here discussing some very common terminologies.
A Session (or test script or simply script) represents a typical session of a web application user interaction. For example, for a web banking application, some typical session may be ,
1. Log in, Check balances in different accounts and log-out. (check Balance Session)
2· Log in, do a Cash deposit to the account and log-out (Cash Deposit Session)
3· Log in, Change Address & log-out (Address Change session)
Effectively, a session is a sequence of page navigation by a user. A Page represents a user click on a link or a specific URL request in browser’s Address input box. For example, In the case of Web Banking application, Web Banking URL is first entered by a user in its browser’s address input box or recalled from a bookmark (favorites). This is a page request.This would result in a log in form presented to user. User now enters User name and password and click “Submit”. Clicking submit is another page request. A Page request may result in multiple URL requests including Main URL and the Embedded URLs such as images etc. Main URL is typically the container HTML URL and images (gifs, jpegs etc) are embedded URLs.
After every page, user would spend some time to view/think. This is called Page Think Time.
A collection of one or more page navigation may be grouped together as Transaction.
So, A session consists of page(s) and /or transaction(s). A Transaction consists of pages.
Virtual User is the software simulation of real world user. Virtual User represents a real world user and a session represents what it does.
A scenario is the overall definition of a test. A scenario has one or more scenario groups. Each scenario group consists of a group of virtual users executing a test script.
Scenario Configuration (Work Load Modeling) :- Some basic concepts to be taken care of while creating a scenario or Work Load model.
Timing accountability of test runs :- A test run passes through Ramp Up (users are ramped to specified number), Actual Run And the Ramp Down phases. Timings statistics is collected for the whole test run. During the test run, timings statistics are shown for the entire test run. Its important to trim the result and take the peak load of the Test run executed. For the best reading the Ramp-up and Ramp down times should be excluded from the result file This will keep the Standard deviation close to mean. It is a good practice to have a Warm up run before the start of Workload it will help to cache the data thus stabilizing the Average response time
Ramp up :- Consider a scenario that is configured to run with 1000 virtual users. It may always not be a good idea to let the Tool start all 1000 virtual users at once & open the floodgate of connection initiations to server It may rather be desired to ramp up the users the reason is If Server goes into overload condition, it may take time for it to come into steady state & hence the need of elongating the test runs.In order to simulate a realistic scenario, users may have to be spaced appropriately.
Warm-up :- Response time measurements do not start till all users are ramped up. By default, measurement would start as soon as the last user has started. Sometimes, it may desirable to add a warm-up period before starting the actual run phase so as to allow for server to stabilize for the peak load. If you notice in progress reports that the average response time is relatively higher in first few progress reports after ramp up than the rest of the intervals, it may be an indication that server has not stabilized after ramp up. It may be useful, in such conditions, to add or extend the warm up phase To setup ramp up configuration, Click Edit Schedule on Scenario Configuration screen and than click on Warm Up Tab of Edit Schedule screen.
Page Think Time :- It is really un-realistic for any real user to just keep clicking the pages one after the other without pausing to look at it. After a page is accessed, the user would spend some time viewing it. The average viewing time depends upon the page contents & the user familiarity of the page. Each Page may be assigned a think time. If a specific think time is not associated with a page, default Page think would be used for such pages. Page Think Time is also called the Page View Time (after a page is downloaded).
Pacing Time :- Load on the server does not simply depend upon the number of concurrent users. The pace at which a virtual user is generating session (fixed Arrival Rate scenarios) or time for which Vertual user goes into a sleep mode after completeing one round of execution (in conncurent load model) is also equally responsible for the load on the server. Since, pacing is a key element in load determination, it is important that Pacing configuration for ascenario is realistic.After a virtual user has completed executing a test script, it would start executing the next iteration of the session associated with its scenario group. The timing of next iteration of session execution depends upon the pacing configuration of the session.If No Pacing configuration for a session is defined, the default pacing by tool is used for such sessions.
Percantage User Mode :- Usually, the number of user in each scenario group is specified in the scenario group definition. Effectively, you specify exact number of users in each scenario group. This is useful in the situations, such as Simulate1000 virtual out of them there is exactly 1 administrator that is always connected to web application and doing some special kind of query at certain frequency.Simulate the actual entire user community of 200 customer support agents in 4 different locations with specific user population of 65, 35, 90 & 10 But, there are situations, when the number of users in different scenario groups is known as the ballpark mix. Effectively, number of users in different scenario groups is specified as percentage of the total users. For example, if there are 3 scenario groups. They may have 60%, 30 and 10% as the percentage. To set the percentage user mode, firstly define the scenario type on at the Scenario Type tab of Scenario Management screen. Navigate to Scenario Management screen by clicking Edit Scenario button on Scenario Configuration screen.
User Profile :- All users belonging to a scenario group share same common characteristics. These characteristics include:
1.Network Access method employed by the user to access the web application e.g., 56 K dial-up modem, 512K DSL, cable modem, T1 etc.
2.Geographic location of the users. For example, East Cost, mid west, Asia etc.
3.Geographic location affects the number of hops, packet loss etc.
4.Web Browser Used by users such as NetScape4, IE 5.0 etc
A common virtual user characterization of a scenario group is called User Profile. We may define a User Profile (let us call it Internet Users) with
40% 56k Dial-up, 20% 384K DSL, 30% 1024K DSL, 10% 1.5Mbps cable modem
30% East Coast, 30% West Coast, 25% Mid-West, 10% Europe, 5 % Asia
30 % IE 5.0, 60% IE 6.0 10% Netscape 4
A scenario group is associated with a single User profile. But multiple scenario groups may share same user profile. This would happen in the situation when such scenario groups have different test script associated with them.
HTTP Keep-Alive :- HTTP 1.0 with Keep-Alive header and HTTP 1.1 (by default) reuses TCP connection to send multiple HTTP requests. Use of keep alive can have an important impact on the server response time and throughput as a function of concurrent users. It may be helpful to checkout the Response time & throughput (in session/minute) for different extent of keep-alive. This may help in determining the best settings for your web application.
Connections Left Open by Browser :- There is one more artifact of the HTTP keep-alive. Typically, all the browsers make HTTP requests with keep alive. They do not disconnect the TCP connection even after they have received the request in the hope that browser user may request an URL that may use the left open connections. Servers usually have a time out (called Keep-Alive Timeout) of 5 minutes for such idle connections. If server has not received next request within keep alive timeout period, server would close the connection. Usually, during a typical web browsing session, this keep-alive timeout helps in reusing the open connection. But when the web browser user changes the site or stops browsing altogether, connections are still left open by the browser. Server would ultimately close these connections after Keep-Alive timeout. These open connections to server add to the number of open connections to server and usually would have an impact on server performance. As a result, it is a good practice to simulate this behavior. Different tools have different way of dealing with this problem.
One of the most important things that we need to understand the concept of queuing and what role it plays in performance testing.
Run Queue – In modern computers many processes run at once, to ensure each program has a fair share of resources each one is run for a period, when a program is taken out to let another run it is placed on the end of the run queue, and the program at the head of the run queue is then allow check the run queue.
Scheduler run queue, The scheduler maintains a run queue of all of the threads that are ready to be dispatched. All the dis-patchable threads of a given priority occupy positions in the run queue. The fundamental dis-patchable entity of the scheduler is the thread. AIX® 5.1 maintains 256 run queues (128 in AIX 4.3 and prior releases). In AIX 5.1, run queues relate directly to the range of possible values (0 through 255) for the priority field for each thread. This method makes it easier for the scheduler to determine which thread is most favored to run. Without having to search a single large run queue, the scheduler consults a mask where a bit is on to indicate the presence of a ready-to-run thread in the corresponding run queue.
Starting with AIX 4.3.3, each processor has its own run queue. The run queue values reported in the performance tools will be the sum of all the threads in each run queue. Having a per-processor run queue saves overhead on dispatching locks and improves overall processor affinity. Threads will tend to stay on the same processor more often. If a thread becomes executable because of an event on another processor than the one in which the newly executable thread had been running on, then this thread would only get dispatched immediately if there was an idle processor. No preemption occurs until the processor's state can be examined (such as an interrupt on this thread's processor).
On multiprocessor systems with multiple run queues, transient priority inversions can occur. It is possible at any point in time that one run queue could have several threads having more favorable priority than another run queue.
The average number of threads in the run queue can be seen in the first column of the vmstat command output. If you divide this number by the number of processors, the result is the average number of threads that can be run on each processor. If this value is greater than one, these threads must wait their turn for the processor (the greater the number, the more likely it is that performance delays are noticed).
When a thread is moved to the end of the run queue (for example, when the thread has control at the end of a time slice), it is moved to a position after the last thread in the queue that has the same priority value.
Processes and threads :- A process is an activity within the system that is started by a command, a shell program, or another process.Each process is made up of one or more threads. A thread is a single sequential flow of control. Multiple threads of control allow an application to overlap operations, such as reading from a terminal and writing to a file.
Multiple threads of control also allow an application to service requests from multiple users at the same time. Threads provide these capabilities without the added overhead of multiple processes such as those created through the fork() system call.
Performance Counter Definitions
Queuing - Inevitable fact of life
There are two main features of queue: arrival rate and service rate.The arrival rate is the frequency (how often) and distribution (how many arrive at once or across time) of the things arriving for a service. It could mean the number of people arriving per hour (average) to be served at a bank and the time (average) Bank takes to serve each person. Queues don't behave in a linear manner.
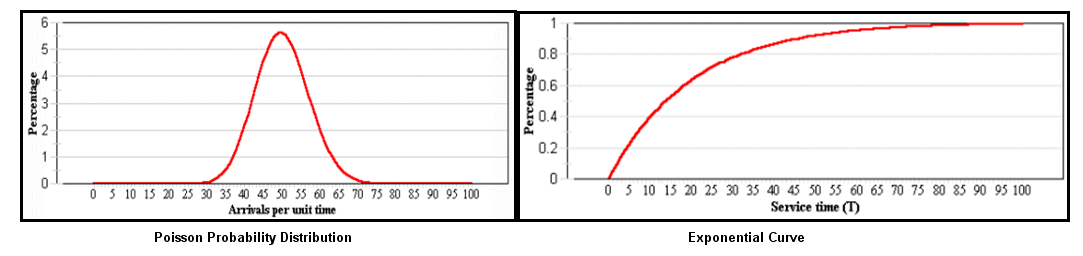
Application server serves the request on first come first serve basis.The different Arrival rate which can be considered are Poisson arrival rate and exponential service rate queue.A Poisson distribution is sometimes called a "normal" distribution in that most things arrive at an average rate (say 1 per minute) but some requests arrive very quickly (say 1 per second) and some arrive very slowly (say 1 per 10 minutes).The exponential service rate means that most people do things quickly, but some take absolute ages (how often have you observed that at a supermarket checkout).
Poisson Probability Distribution and Exponential Curve
I ll try to explain how the run queue can affect the over all reading
There are 2 important thins 1. Request Arrival rate and 2. Request Service Rate. Our arrival rate can be estimated (average) and our service rate can also be estimated (again an average). Its very important for a performance test engineer to understand how a wrong modeling can affect the performance results. Lets Understand how this wrong modeling or unwanted Queuing affect the performance Application.
Example :- The below example is on assumption that the server can serve 1 request per second.
1. Load Model 1 sends 1 request at a time So when the 1st request is solved the 2nd request arrives and it immediately gets the CPU attention and it is served.so the average response time for 2 requests in Load model 1 is (1+1)/2 = 1 secs
2. Load model 2 - which sends 2 requests per second , where as server's capacity is it can take only 1 request at a time, so these 2 requests arrive at the server for its attention one request is being served while other is waiting on the queue. Server does it work properly as expected and served the 1st request in 1 second and then served the 2nd request which was on the queue in one second.But for the 2nd request the total response time is 2 secs ( Waiting time 1 sec + serving time 1 sec). Thus affecting the average response time (1+2)/2 = 1.5 second.
As a performance engineer I can attribute this change in response time to wrong modeling. if you see every component of AUT is doing their job properly the only problem here is the modeling. So we must study the load model of Application and try to make the Workload as close as possible to avoid such problems.
If you are not confident of the results then its better to call it as a NO SHOW then to publish wrong results.
Modeling the correct type of work load is the key to have a predictable result. The reality is, if the Performance Test Engineer is able to model the right apple to apple comparison then he will be able to have a valid test result predict the application behavior in Production. As a Performance tester one has to apply all due diligence before publishing the test results. The reason is as a performance test engineer you have managed to get the confidence of the management and what ever results you post that is trusted by the audience. So if you are not confident of the results then its better to call it as a NO SHOW then to publish wrong results.
System workload :- An accurate and complete definition of a system's workload is critical to predicting or understanding its performance. A difference in workload can cause far more variation in the measured performance of a system than differences in CPU clock speed or random access memory (RAM) size. The workload definition must include not only the type and rate of requests sent to the system, but also the exact software packages and in-house application programs to be executed. It is important to include the work that a system is doing in the background. For example, if a system contains file systems that are NFS-mounted and frequently accessed by other systems, handling those accesses is probably a significant fraction of the overall workload, even though the system is not officially a server.A workload that has been standardized to allow comparisons among dissimilar systems is called a benchmark. However, few real workloads duplicate the exact algorithms and environment of a benchmark. Even industry-standard benchmarks that were originally derived from real applications have been simplified and homogenized to make them portable to a wide variety of hardware platforms. The only valid use for industry-standard benchmarks is to narrow the field of candidate systems that will be subjected to a serious evaluation. Therefore, you should not solely rely on benchmark results when trying to understand the workload and performance of your system.
It is possible to classify workloads into the following categories:
Multiuser :- A workload that consists of a number of users submitting work through individual terminals. Typically, the performance objectives of such a workload are either to maximize system throughput while preserving a specified worst-case response time or to obtain the best possible response time for a constant workload.
Server :- A workload that consists of requests from other systems. For example, a file-server workload is mostly disk read and disk write requests. It is the disk-I/O component of a multiuser workload (plus NFS or other I/O activity), so the same objective of maximum throughput within a given response-time limit applies. Other server workloads consist of items such as math-intensive programs, database transactions, printer jobs.
Workstation :- A workload that consists of a single user submitting work through a keyboard and receiving results on the display of that system. Typically, the highest-priority performance objective of such a workload is minimum response time to the user's requests.
Performance objectives
After defining the workload that your system will have to process, you can choose performance criteria and set performance objectives based on those criteria.
The overall performance criteria of computer systems are response time and throughput.
Response time is the elapsed time between when a request is submitted and when the response from that request is returned.There are generally 2 types of response times Server Response time ( Time between 1st byte of data reaches the server and last byte of data returned by the server) and end user response time (time between the users sumits the request by an action from UI until the browser is fully loaded with the response). Examples include:
• The amount of time a database query takes
• The amount of time it takes to echo characters to the terminal
• The amount of time it takes to access a Web page
Throughput is a measure of the amount of work that can be accomplished over some unit of time. Examples include:
• Database transactions per minute
• Kilobytes of a file transferred per second
• Kilobytes of a file read or written per second
• Web server hits per minute
The relationship between these metrics is complex. Sometimes you can have higher throughput at the cost of response time or better response time at the cost of throughput. In other situations, a single change can improve both. Acceptable performance is based on reasonable throughput combined with reasonable response time.
In planning for or tuning any system, make sure that you have clear objectives for both response time and throughput when processing the specified workload. Otherwise, you risk spending analysis time and resource dollars improving an aspect of system performance that is of secondary importance.
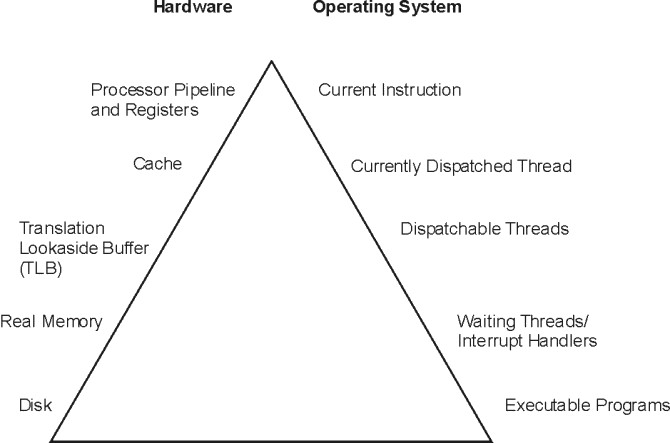
Program execution model :- To clearly examine the performance characteristics of a workload, a dynamic rather than a static model of program execution is necessary, as shown in the following figure.